
Read the instructions at the bottom of the page to help you use and interpret brix levels:
Brix Tracker
| Date | Time | Block/Field | GPS | No of Trees | Brix (%) | EC (mS/cm) | Weather | Treatments | Notes |
|---|
Complete each field, then click Add Entry to record the Brix % in the table. When you are done recording the Brix you can export a CSV to your computer. The table will be available as long as you use the same browser and don't clear your browser history.
Using Brix to Monitor Macadamia Tree Health
1. Why Monitor Brix?
Monitoring Brix gives real-time feedback on the tree’s health and metabolic strength.
-
Brix measures sugar concentration in sap, which is directly linked to:
-
Photosynthesis efficiency (the tree’s energy production).
-
Nutrient density in the plant tissue.
-
Soil microbial health (good soil = better sugar flow).
-
Resilience to stresses (both pests/diseases and environmental challenges).
✅ Higher Brix = Stronger plant defences against pests and diseases (biotic stress).
✅ Higher Brix = Better drought resistance, salinity tolerance, and cold/heat resilience (abiotic stress).
✅ Tracking Brix trends helps you spot problems before you see symptoms.
2. How to Use Brix to Monitor Tree Health
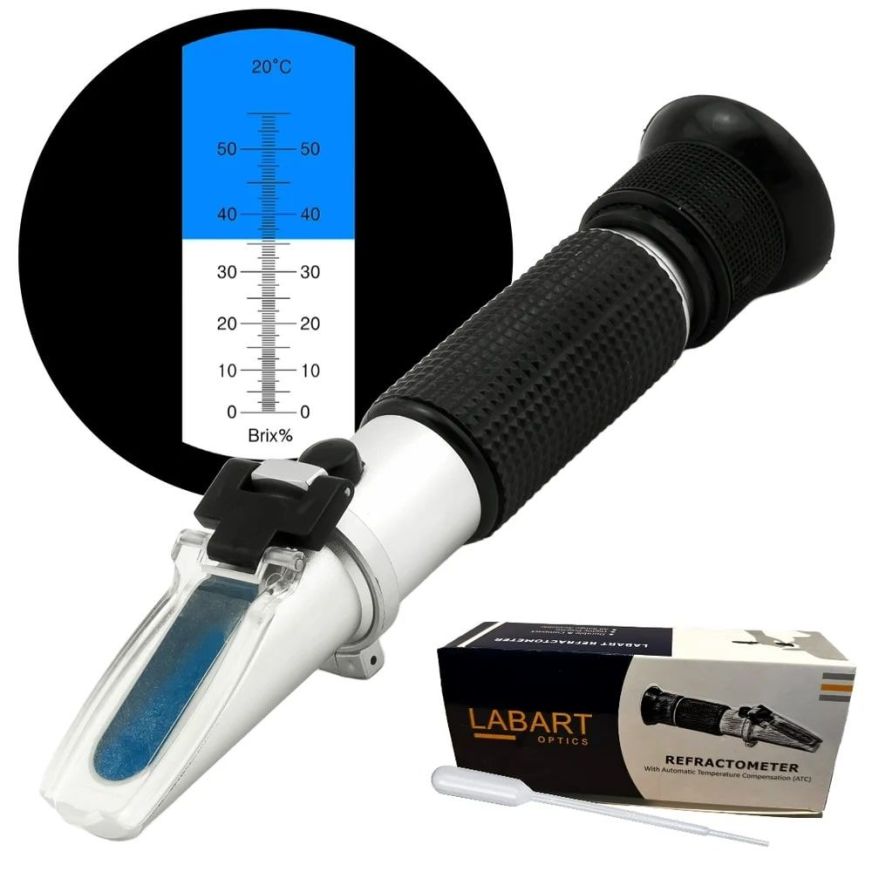
What You Need
- Handheld refractometer (optical or digital)
- High-pressure sap press
- Distilled water and a soft cloth (for cleaning)
- Notebook or mobile app for recording results

Using Brix to Monitor Macadamia Tree Health
2. How to Use Brix to Monitor Tree Health
- What You Need
- Handheld refractometer (optical or digital)
- High-pressure sap press
- Distilled water and a soft cloth (for cleaning)
- Notebook or mobile app for recording results
- When to Measure
- Time: 11:00 am to 4:00 pm (sunny weather is best)
- How often:
- Every 2 weeks during active growth
- Weekly during flowering, nut filling, and stress periods
- How to Take a Brix Reading
- Choose 3–5 healthy, fully expanded leaves from mid-canopy.
- Avoid stressed, diseased, or shaded areas unless you’re troubleshooting.
- Crush the leaf with a sap press to extract sap.
- Place a drop of sap on the refractometer lens.
- Read the Brix value (in %).
- Clean the lens with distilled water after each sample.
- Record each reading, and average the readings per block or field.
Using the same method, you can also check Brix on nut sap and EC during the nut development stages.
3. Interpreting Leaf Brix and EC Readings
Optimum Leaf Brix Levels
|
Brix Level |
Meaning |
Action |
|
< 6 ºBx |
Poor energy, weak immune system |
Improve nutrition, soil biology, reduce stress |
|
6-9 ºBx |
Average health |
Boost photosynthesis with foliars, monitor closely |
|
10–12 ºBx |
Good health |
Maintain soil/foliar program |
|
>12 ºBx |
Excellent health |
High resistance to pests and stress |
Optimum Leaf and Nut Brix Levels for Each Growth Stage
|
Growth Stage |
Optimum Leaf Brix |
Optimum Nut Brix |
Notes |
|
Early Vegetative |
8-10 |
- |
Focus on strong canopy growth |
|
Flower Bud Initiation |
9–11 |
- |
Support high energy demand |
|
Full Flowering |
10–12 |
- |
Critical for pollination success |
|
Nut Set |
10–12 |
7–8 |
Ensures strong initial nut fill |
|
Early Nut Fill |
11–13 |
8–9 |
Maximise carbohydrate movement |
|
Full Nut Fill |
12–14 |
9–10 |
Indicates good oil accumulation |
|
Nut Maturity |
12–14 |
10–11 |
Best quality and storability |
|
Pre-Harvest |
12–14 |
11–12 |
Highest nut quality achieved |
Pro Tips:
- Always monitor Brix trends over time, not just single readings.
- A rising trend means your regenerative practices are working.
- A falling trend signals a need for immediate action (nutrition, biology, or stress management).
Optimum leaf sap EC (mS/cm) for macadamias at different phenological growth stages:
|
Growth Stage |
Target Leaf Sap EC |
Primary Focus |
Key Nutrients Driving EC |
Notes |
|---|---|---|---|---|
|
1. Early Vegetative (0–2 yrs) |
3.0 – 4.5 mS/cm |
Root & shoot establishment |
Ca²⁺, Mg²⁺ |
Avoid overfeeding; ensure good root development. |
|
2. Pre-Flowering (2–4 yrs) |
4.5 – 5.5 mS/cm |
Canopy growth, bud differentiation |
K⁺, Ca²⁺, Mg²⁺ |
Start ramping up mineral supply for the upcoming reproductive demand. |
|
3. Flowering |
5.5 – 6.5 mS/cm |
Pollen quality, flower retention |
K⁺, B, Ca²⁺ |
High EC helps support pollination and flower vigor. |
|
4. Nut Set & Early Nut Growth |
6.0 – 7.0 mS/cm |
Cell division, rapid nut development |
K⁺, Ca²⁺, Mg²⁺ |
Critical phase—Nut abortion is often linked to low EC or K/Ca imbalance. |
|
5. Nut Fill & Oil Accumulation |
6.5 – 7.5 mS/cm |
Oil synthesis, sugar loading |
K⁺, B, Ca²⁺, Mg²⁺ |
Highest nutrient demand. Maintain consistent moisture & sap flow. |
|
6. Post-Harvest Recovery |
4.0 – 5.0 mS/cm |
Root flush, energy reserve replenishment |
Ca²⁺, Mg²⁺, moderate K⁺ |
Reduce inputs but support root cycling and canopy retention. |
Pro Tips:
-
Sudden EC drops (≥1.0 mS/cm within days) can signal pest attack, water stress, or root dysfunction.
-
EC above 8.0 mS/cm may indicate salt buildup or over-fertilisation, often accompanied by leaf edge burn or tip dieback.
-
Track alongside sap pH: Ideal is 6.2–6.5 at most stages for balanced nutrient uptake.
-
Sap EC is a snapshot of nutrient availability, not total nutrient status like dry leaf analysis.